
Testing and Comparison on XP
First up we have 3dMark06, no explanation needed here I would think, the higher scores the better:
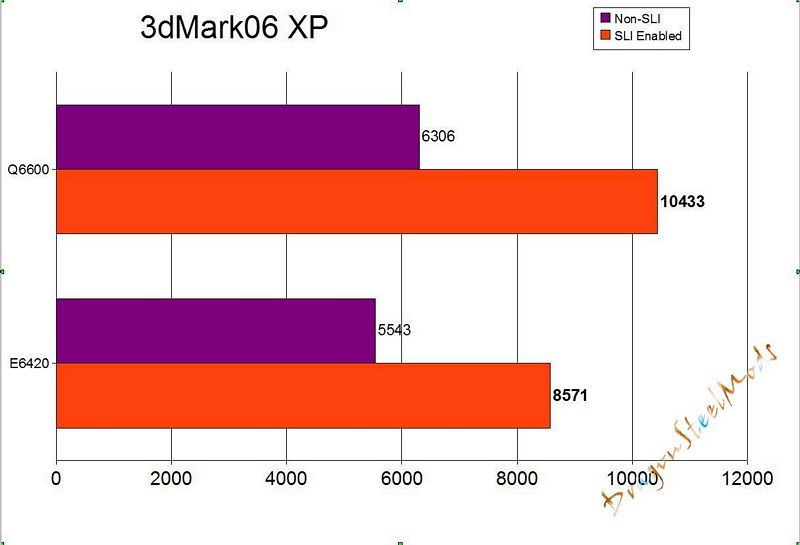
Obviously here the Quad core easily helps to achieve an overall better 3dmark Score, especially when SLI is enabled.
Next up we have Crysis:
The settings were all set to medium with a resolution of 1280×1024 for testing. Crysis has a nice features that allows you to benchmark you’re system, the results are from four passes averaged out.

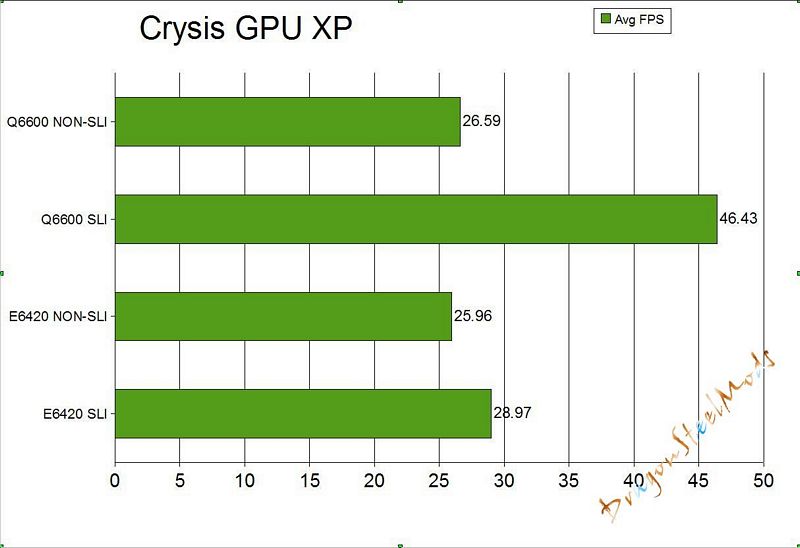
We see over 40FPS using SLI and the Q6600, might not be all that pretty on Medium, but it’s very playable.
Now we have FarCry, here I ran the benchmarks 5 times and averaged out the results to gets the scores you see in the graph. The settings were all maxed and a resolution of 1280×1024.
Res: 1280×1024
Demo: Pier
Pixel Shader: default
Antialiasing: 8x
Anisotropic Filtering: 16x
HDR: level 7

FarCry doesn’t get much of a gain from the quad core, just a slight bump to some already good framerates.
Next we have SuperPi, the time to calculate pi to 1 million, obviously the lower the score or time the better:

almost 2 seconds faster using the quad core CPU, not to shabby…
Next is TMPGEnc
The next test is video encoding or recoding as the case may be, using TMPGEnc to to see how long it takes to encode or re-encode a video file. The file is an AVI file that is being converted to MPG. It is 3 minutes and 48 seconds long, with 5720 frames and is 70.5 MB in size. Of course here again the lower the score the better.

We shaved five seconds off the encoding time.. eh, it’s something I guess.
Now for all the SiSoft Sandra XI Benchmarks:
SiSoft Sandra Cache and Memory test
Benchmark the processors’ caches and memory access (transfer speed).
Combined Index: is a composite figure representing the overall performance rating of the entire Cache-Memory performance in terms of MB/s. The value is the logarithmic average of all the results for the entire address space. (Higher is better, i.e. better performance)
Speed Factor: is a figure representing the speed differential between the CPUs cache and memory. The value is the ratio of the fastest cache (i.e. L1) bandwidth to the main memory bandwidth. (Lower is better, i.e. the memory is not very much slower than CPUs cache)
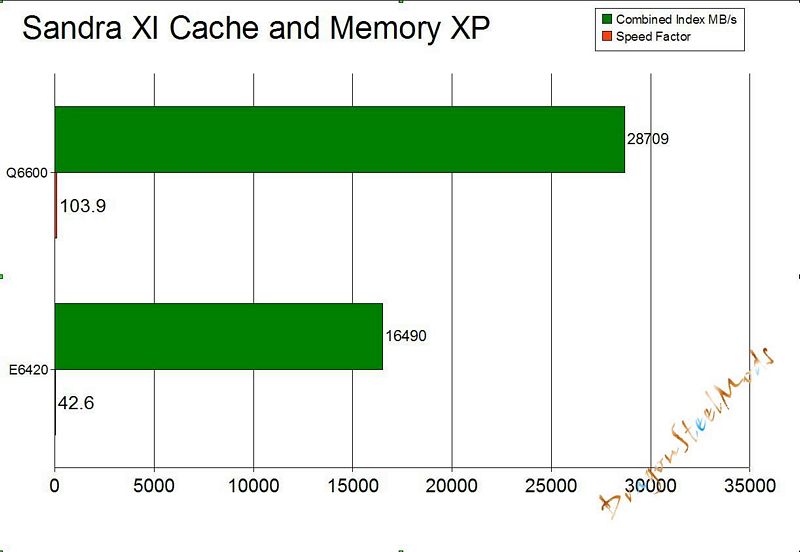
Here we see a huge increase across the board while using the Q6600, BUT with Speed Factor Lower is Better, so the Quad core takes a large hit here.
CPU Arithmetic Benchmark
Benchmarks the ALU and FPU processor units. Shows how your processors handle arithmetic and floating point instructions.
Results Interpretation : Higher index values are better.

Here again we see across the board great results using the Q6600, and both results are Higer equals Better.
Processor Multi-Media
Benchmark the (W)MMX, SSE/2/3/4 processor units. Shows how your processors handle multi-media instructions and data in comparison to other typical processors.
Such operations are used by more specialized software, e.g. image manipulation, video decoders/encoders, games.
Results Interpretation : Higher index values are better.

yet again a drastic increase while using the Quad core…
Memory Bandwidth Benchmark
Benchmarks the memory bandwidth of your computer.
Results Interpretation : Higher index values are better.

Here’s where things get kinda funky, the Dual Core scores better here, apparently it handles memory better than the quad does.
Memory Latency Benchmark.
Benchmark the latency (response time) of processors’ caches and memory
The latency of caches is measured in processor clocks (i.e. how many clocks it takes for the data to be ready) as it is dependent on the processor clock speed.
The latency of memory is measured in nanoseconds as it is typically independent on processor clock speed.
Results Interpretation : Lower index values are better.
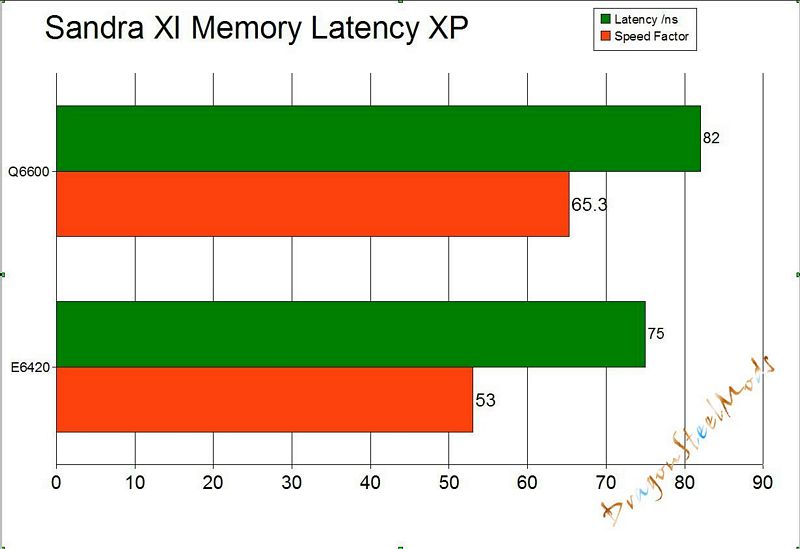
So we see again everything isn’t all great while using the Q6600, lower scores are better so the Dual Core easily takes the lead on this set of tests.
Multi-Core Efficiency
Benchmark the multi-core efficiency of the processors. Shows how efficient the processor cores and their inter-connects are in comparison to other types to other typical processors.
The ability of the cores to process data blocks and pass them to another core for processing (producer-consumer paradigm) of different sizes and different chain sizes is measured. The efficiency of the inter-connect between cores is thus benchmarked; however, the number of cores (and processors) also counts as more data buffers can be processed simultaneously (aka “in flight”).
True multi-core processors that have shared L2/L3 caches will thus perform much better than cores that have separate caches and are connected by the traditional FSB.
Inter-Core Bandwidth :Results Interpretation : Higher index values are better.
Inter-Core Latency :Results Interpretation : Lower index values are better.
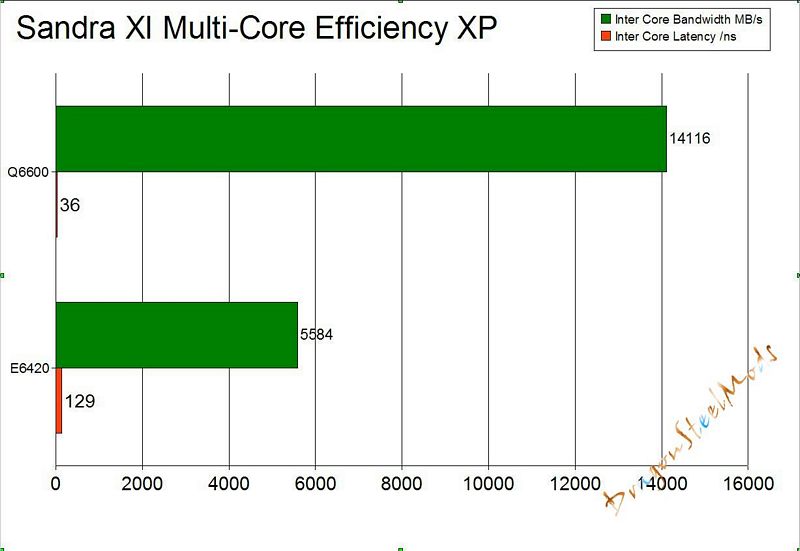
This test is dependent on how the cores process data, and how much of it it can process at a time, so obviously having four cores is better than two.